



 is how we deliver financial intelligence to you. We connect your sources, configure it for your business and use it with you in the weekly sessions. You just log in and see where you stand.



For years, company finances were read in the dark.Manual spreadsheets. Reports that arrive late. Decisions by gut feeling.
We used to work that way too.The judgment was first-rate. The tools couldn't keep up with the pace decisions demand today.
So we built the tool to fix it.
Meet by Bores Finance®
Where your financial intelligence lives.
Slide
Our own strategic financial intelligence platform, powered by frontier AI models. The best of real strategic experience and cutting-edge technology.
Always onNo waiting for month-end close
Traceable to the sourceNo black boxes
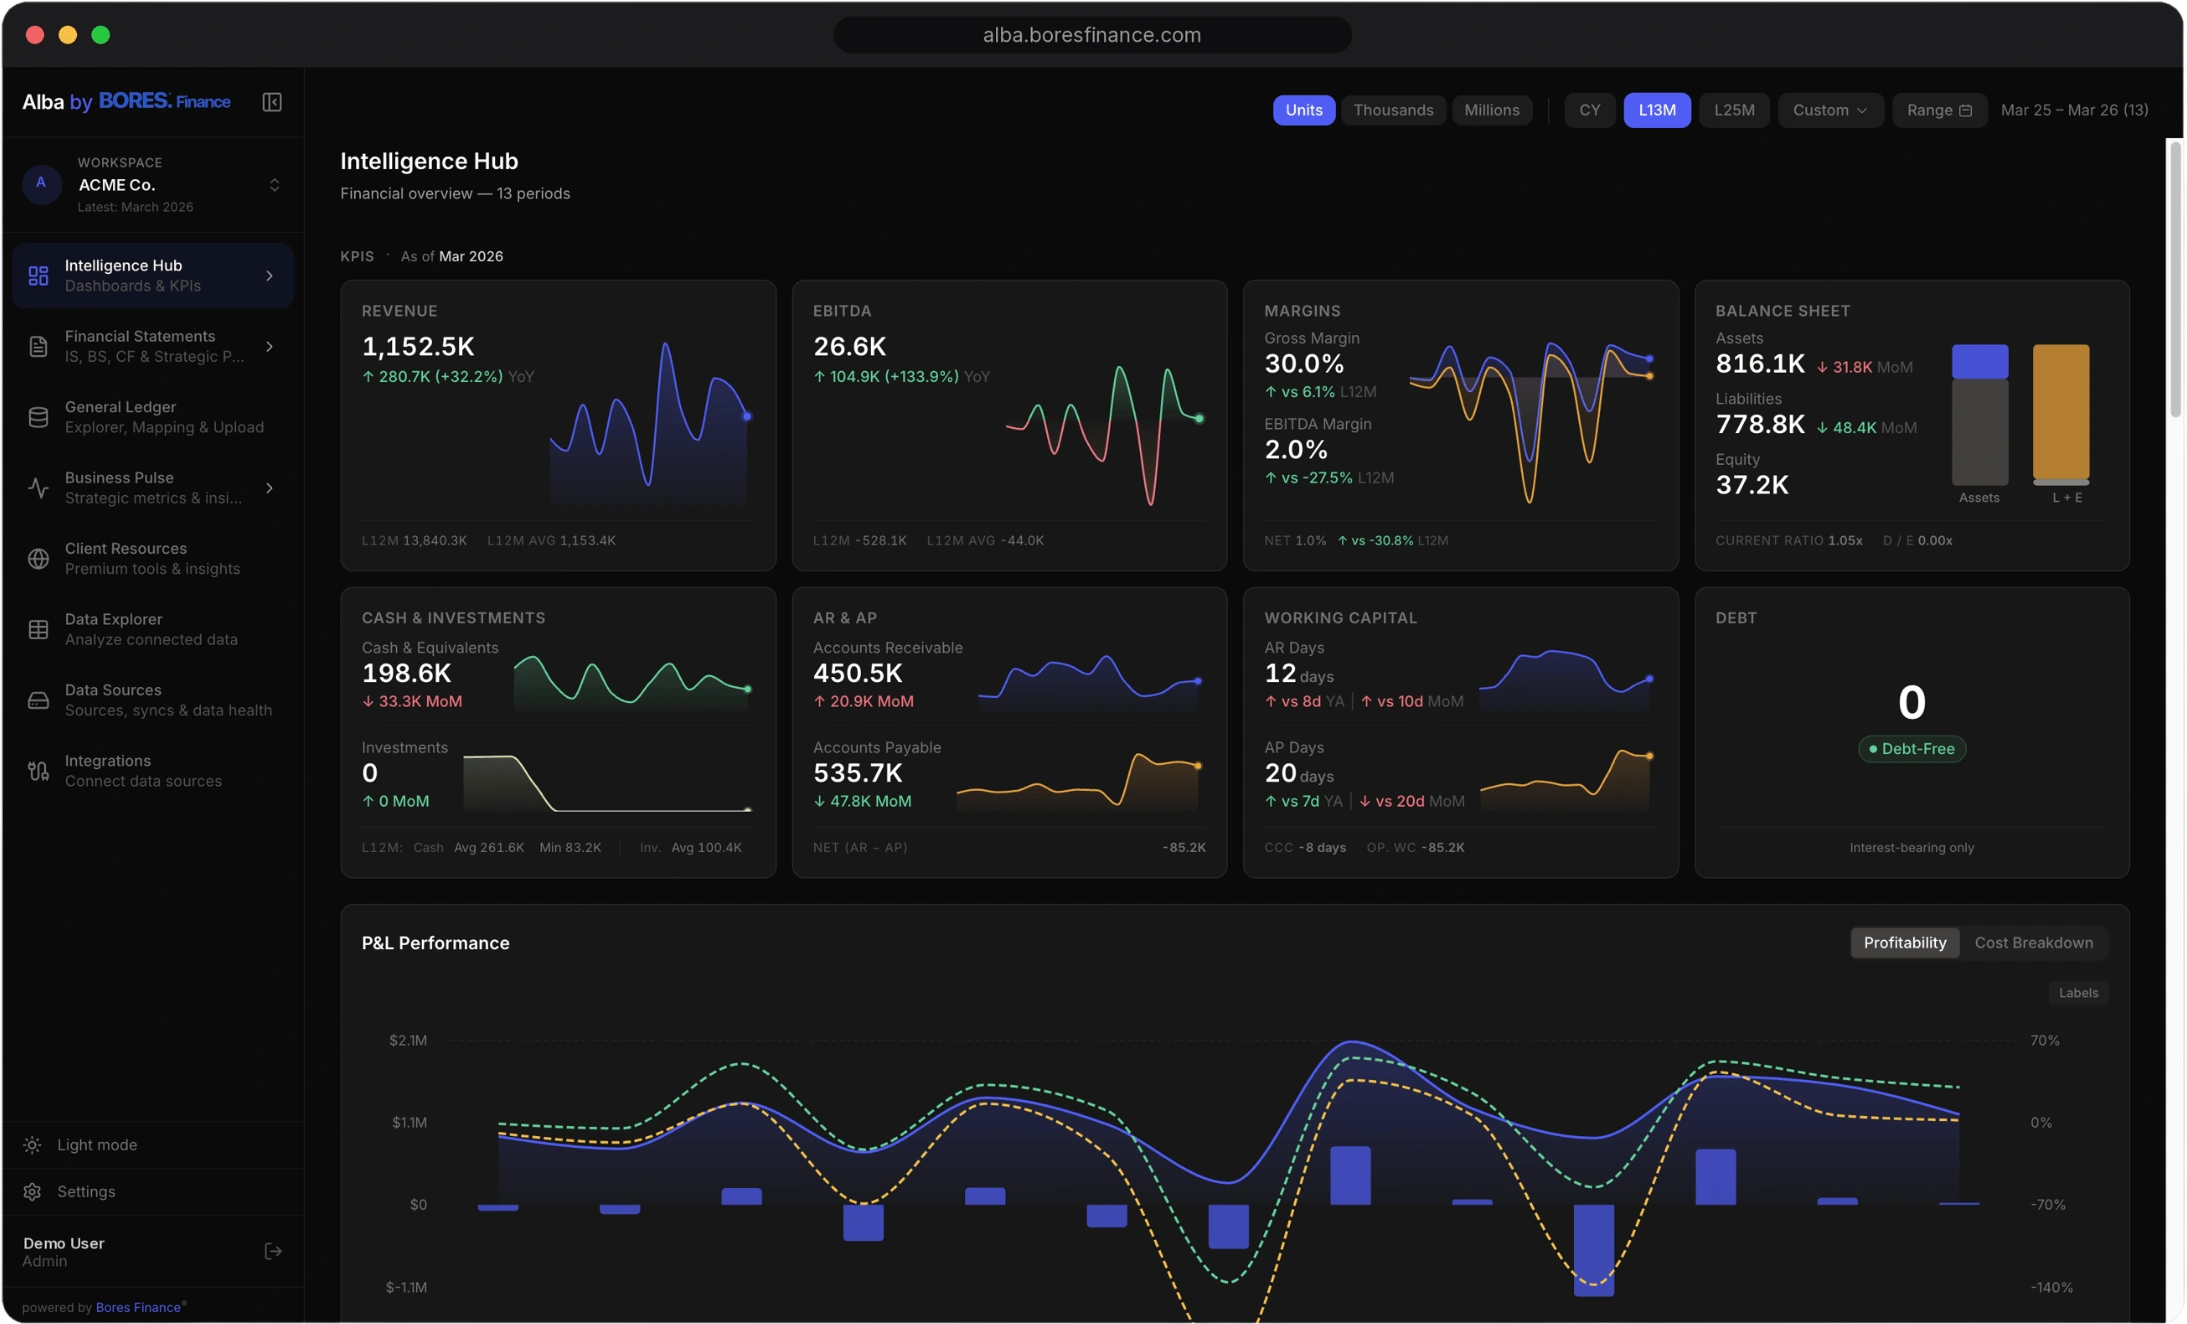
This is what clarity feels like. An operational snapshot of your business, ready for the decision in front of you.
Years of experience. At today's speed.
For years we delivered our work by hand: robust, complex financial models in Excel, updated manually. The thinking and the architecture were first-rate; the tools had reached their limit. So we built , to deliver strategic financial intelligence continuously, at the speed and scale your decisions demand today.
Before · the accountant's PDFNow · 
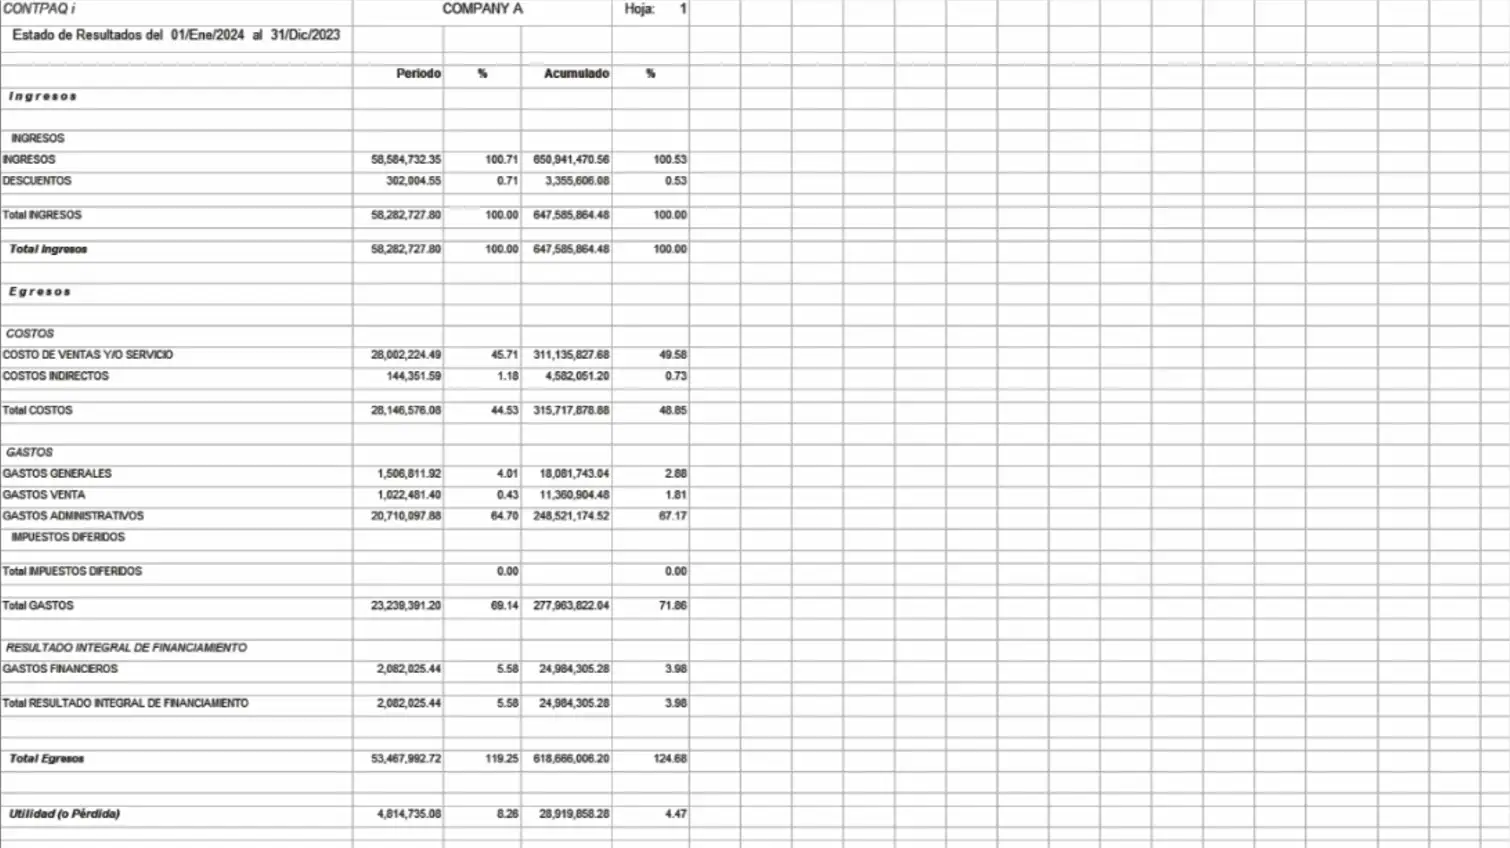
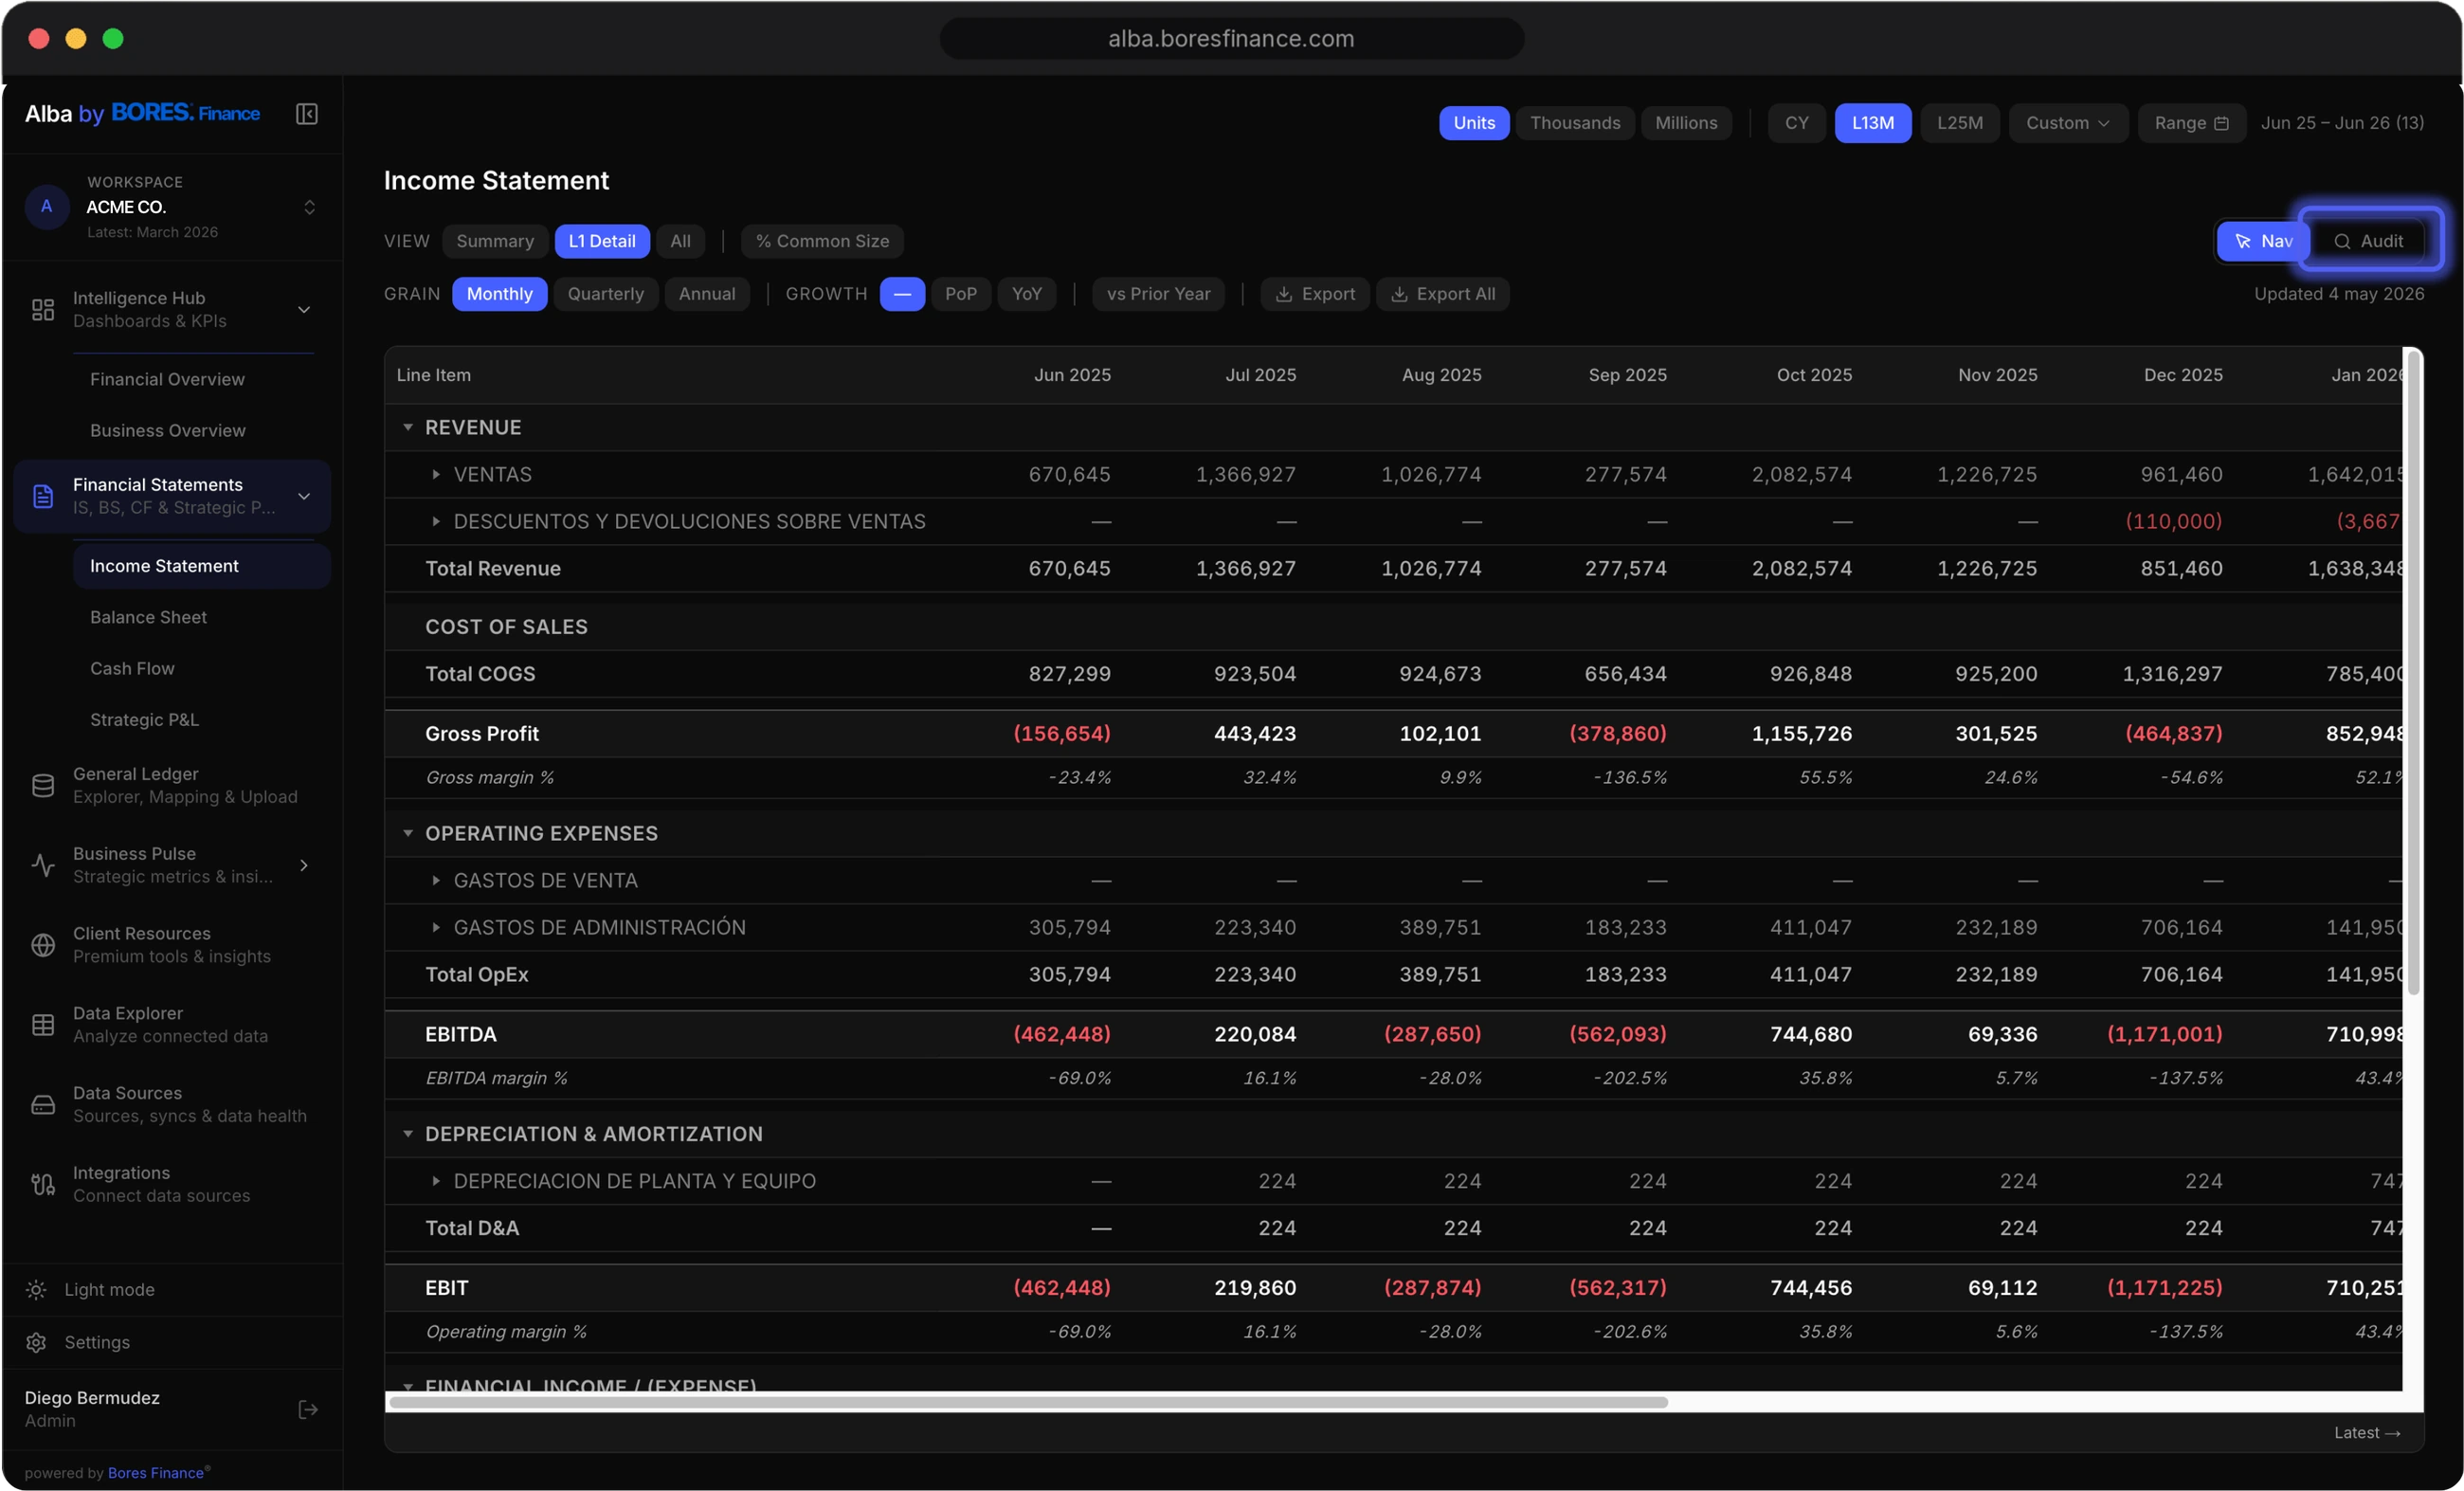
What you get today: a file that tells you what happened.What you see in : what happened, why and what to do.
The home of your business's pulse
It's not software we ask you to adopt. It's how we deliver clarity.
- Tailored to your business. Your KPIs, your metrics, how you read your financial statements, the nuances of your industry and your strategic questions.
- No two clients see the same thing, because no two companies are alike.
- It replaces the fragmented spreadsheets you've already outgrown, with the logic we've refined over years of hands-on work.
- Log in and know exactly where you stand. Without waiting for a monthly report.
It's not a report you wait for. It's a living view of your business, ready when you need it.
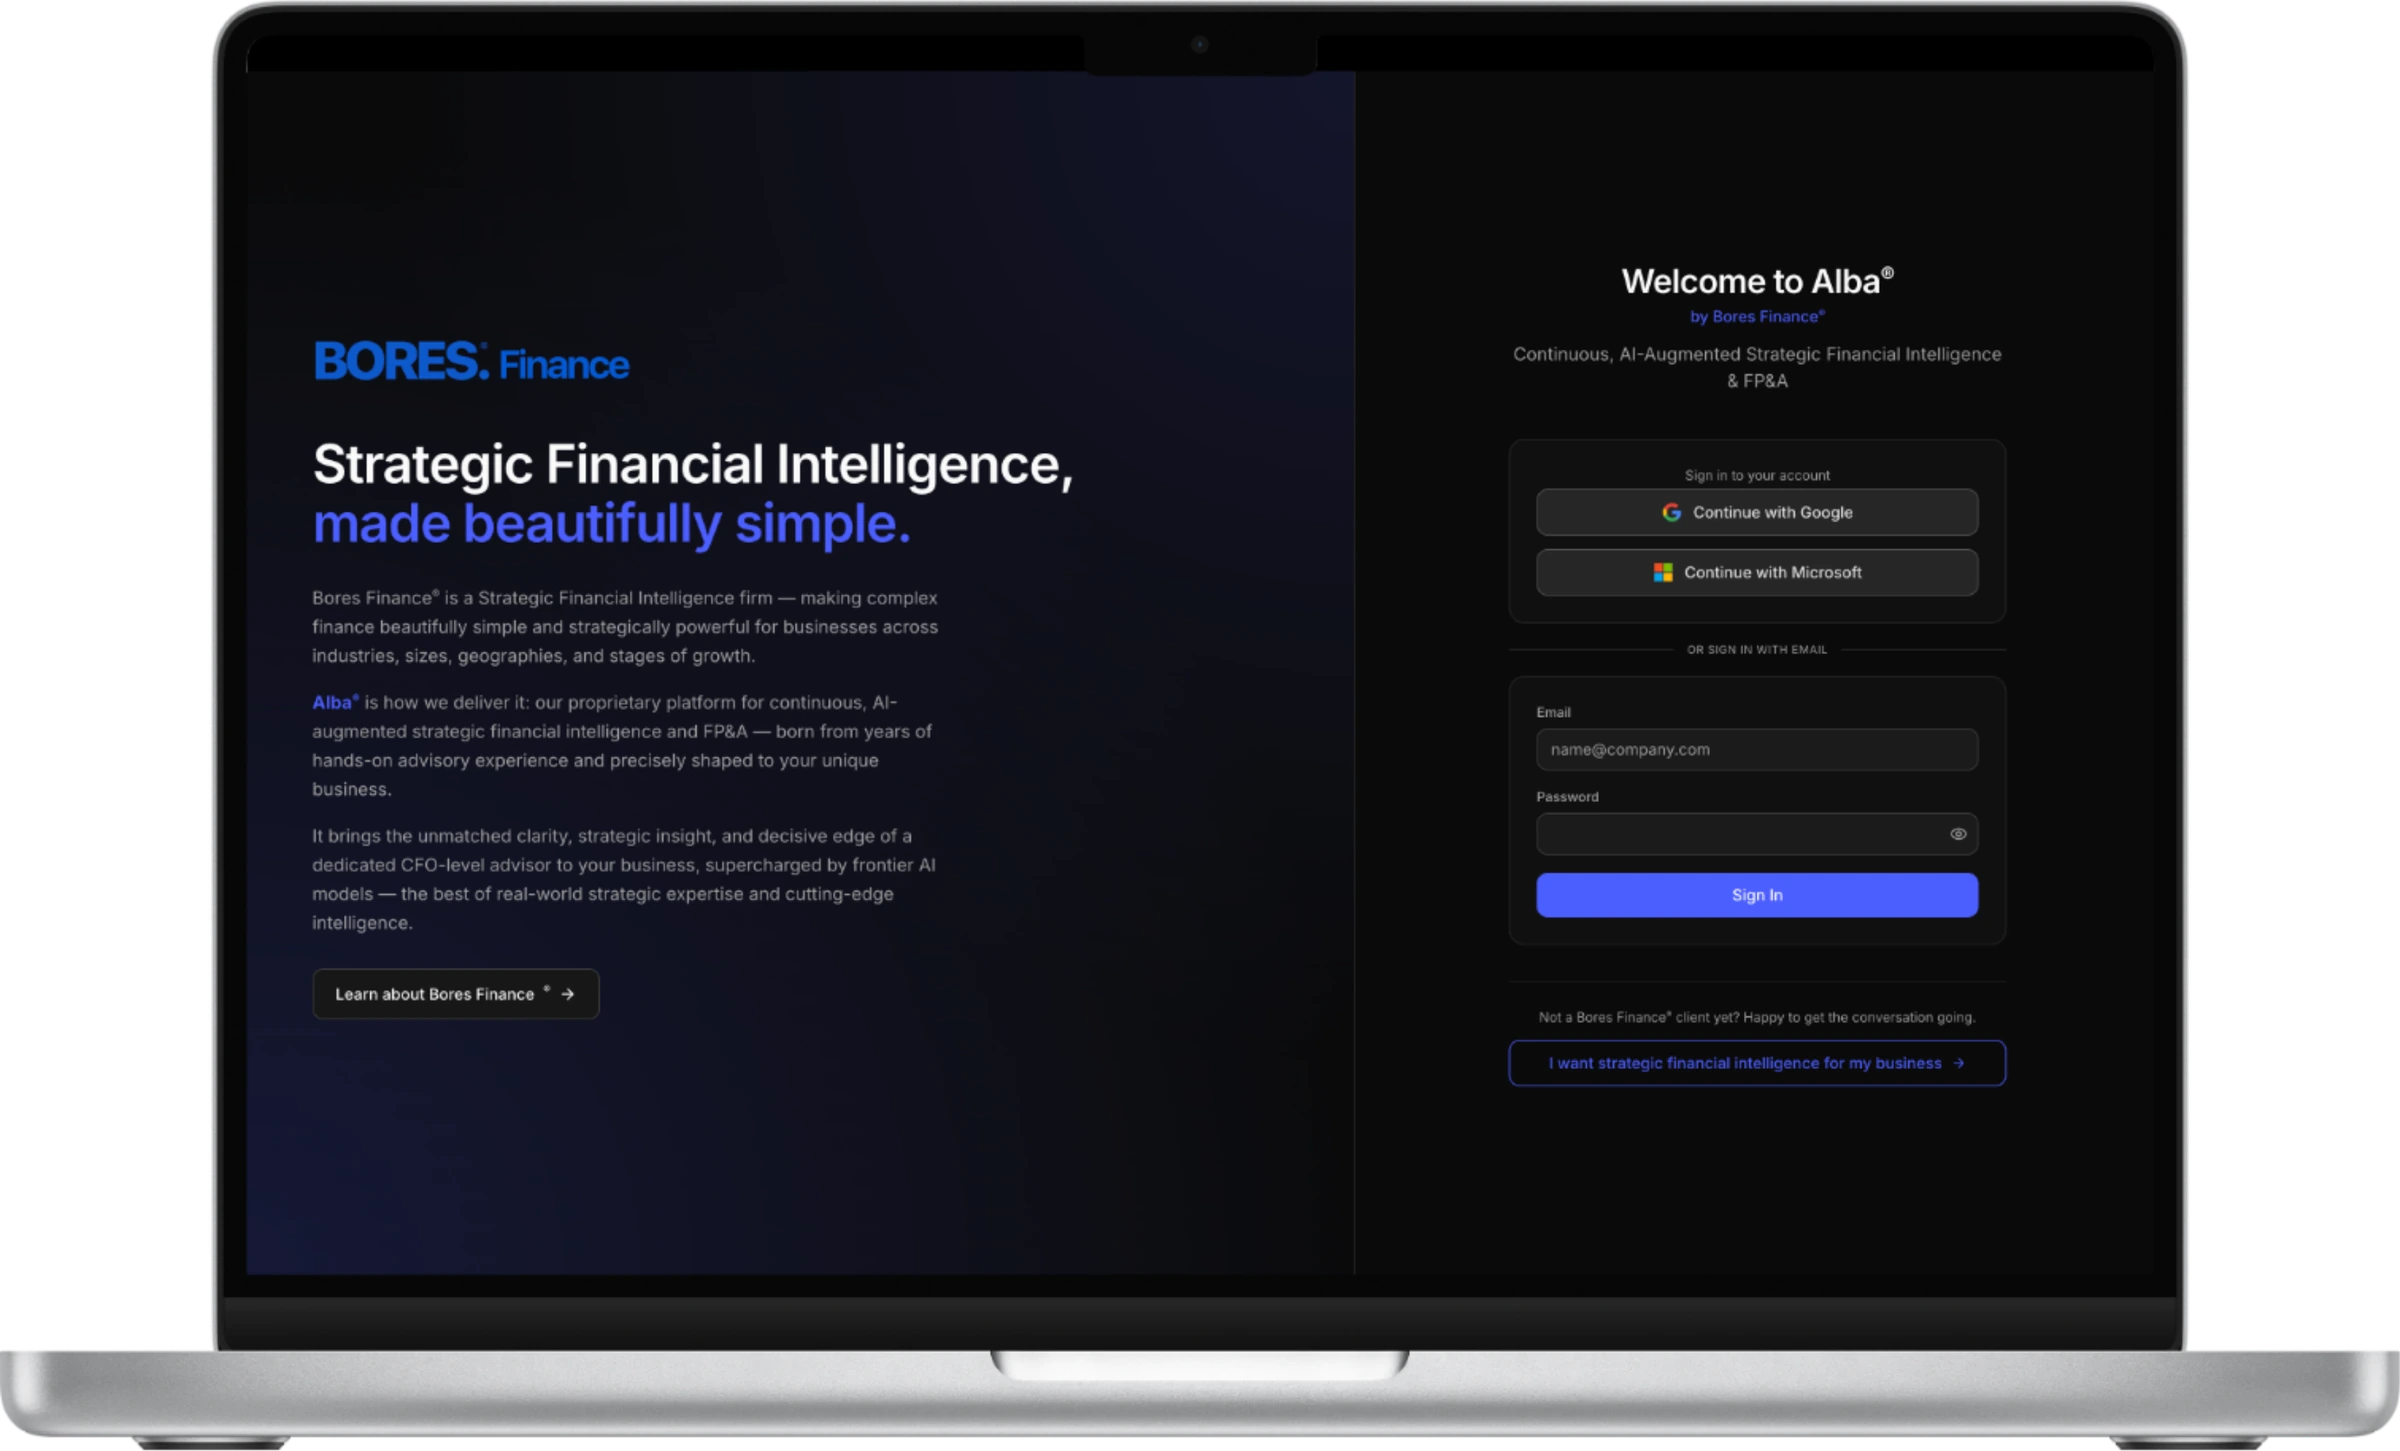
On the pulse of your business.
Your strategic metrics, always up to date, with the context to understand what moved them.
What changed and whySeconds
Not weeks. The explanation comes with the number.
Traceability100%
Every figure, down to the journal entry and file behind it.
Integrations+9
ERP, CONTPAQi, Excel, Google Sheets, Salesforce, HubSpot and more.
Integrations
From scattered data to a single source of truth.
Your numbers live in a dozen places. brings them into one: live, structured, enriched and traceable. We don't ask you to change how you work.
- Your data flows automatically from your ERP, CONTPAQi, Excel, Google Sheets, Salesforce, HubSpot and the tools your team already uses.
- It's organized with the logic that matters for decisions.
- It's enriched with AI-augmented features.
- Every figure is traceable to its source record. No black boxes.








The platformSee
Book a demo in your diagnostic session ›See from the inside.
This is what clarity feels like. Revenue, EBITDA, margins, cash flow, working capital and balance sheet in a single view.
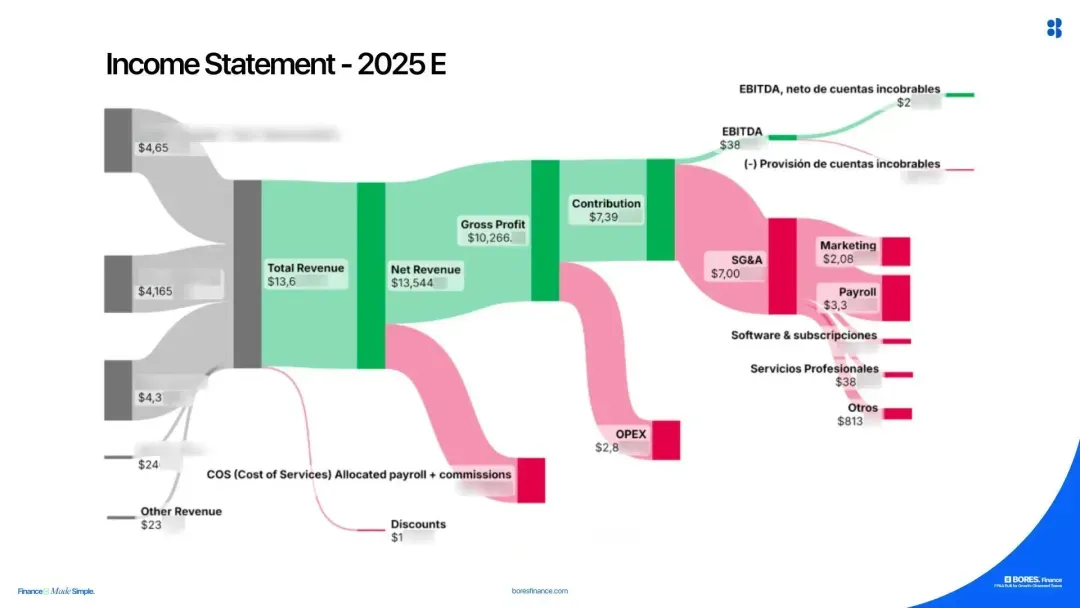
The data you decide with. Your income statement by month, quarter or year, with the financial and non-financial information you actually use.
Real depth. Fully traceable. See the story behind every figure in seconds: not just what changed, but why.
DataStudio®, inside . Visual dashboards your whole team understands and uses to decide.
From the accountant's PDF to
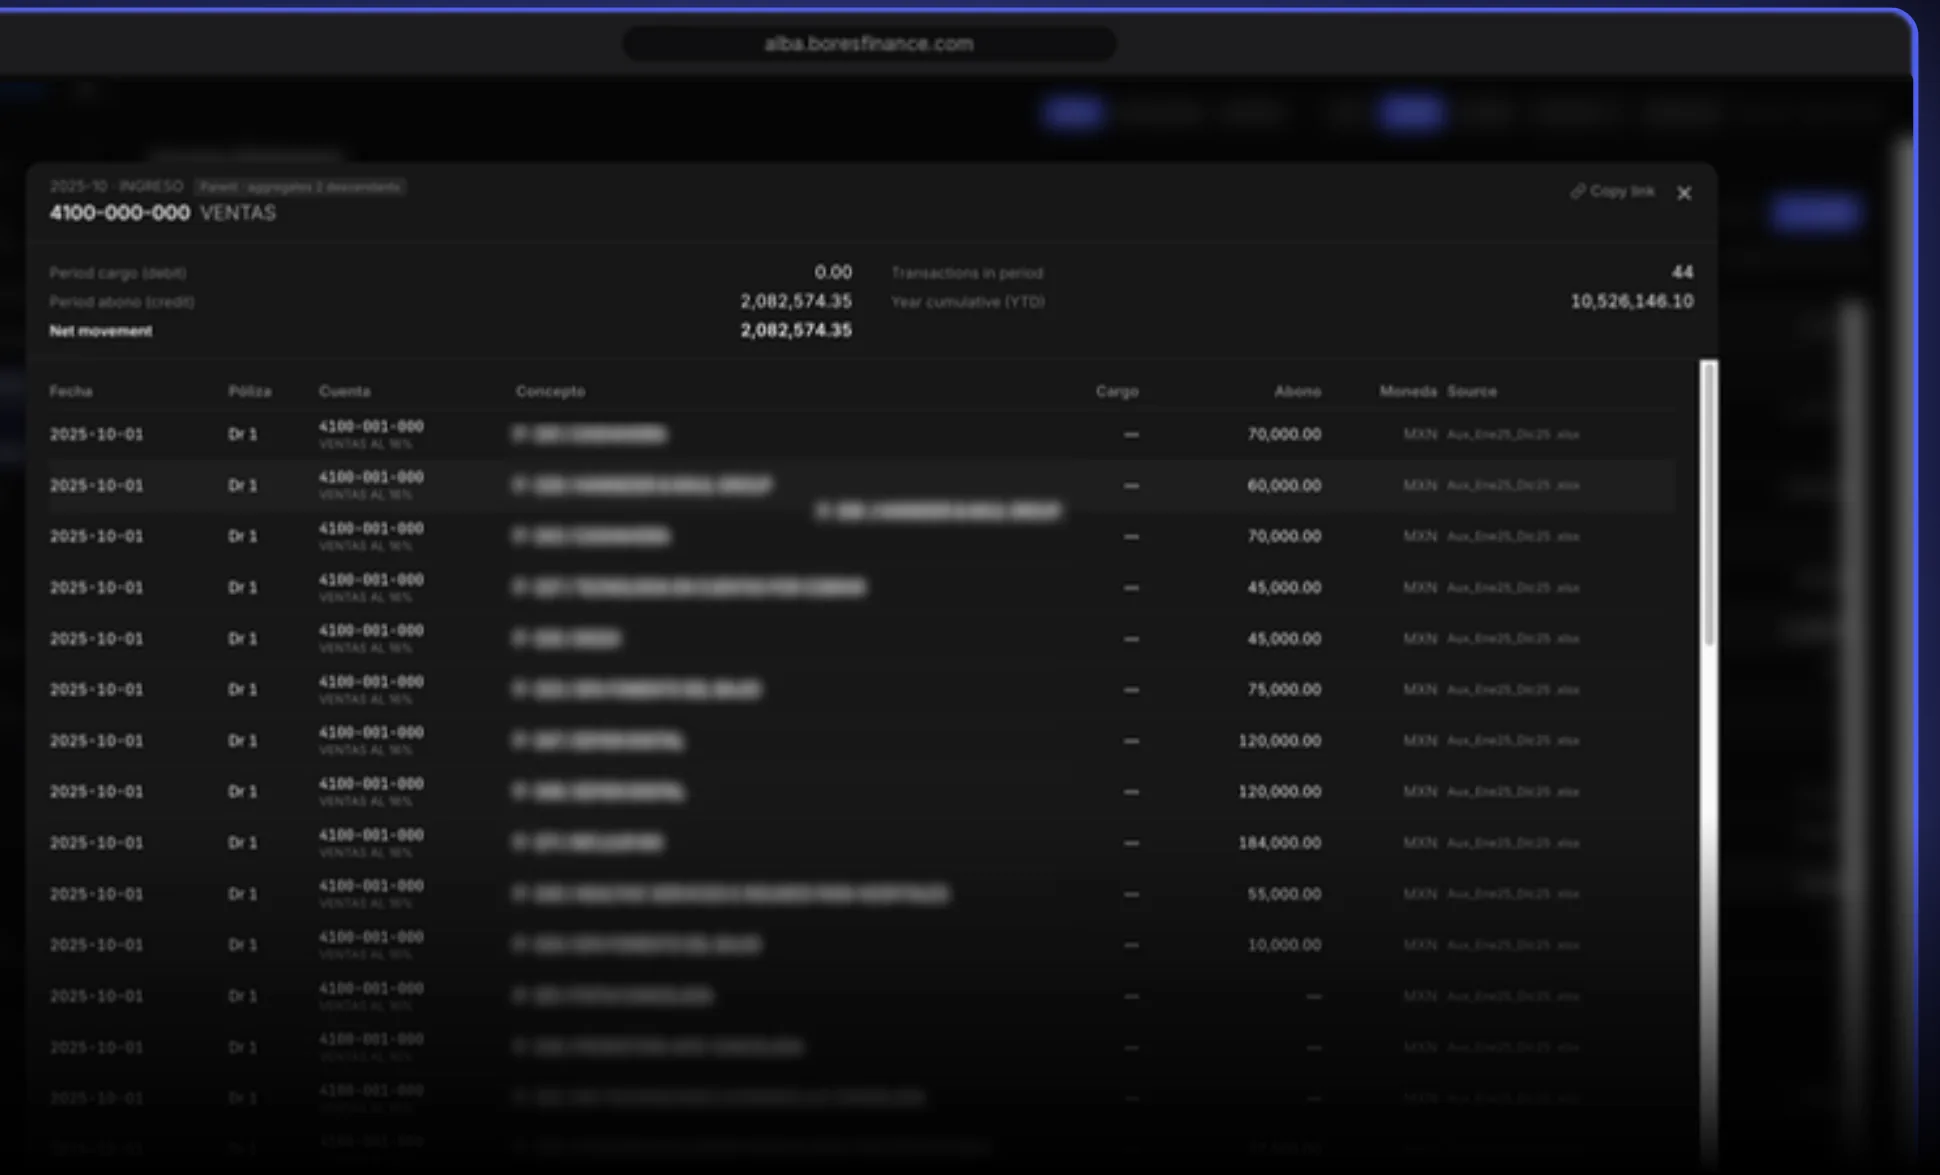
Slide to compare what you get today with what you see in : every transaction, traceable to the journal entry behind it.
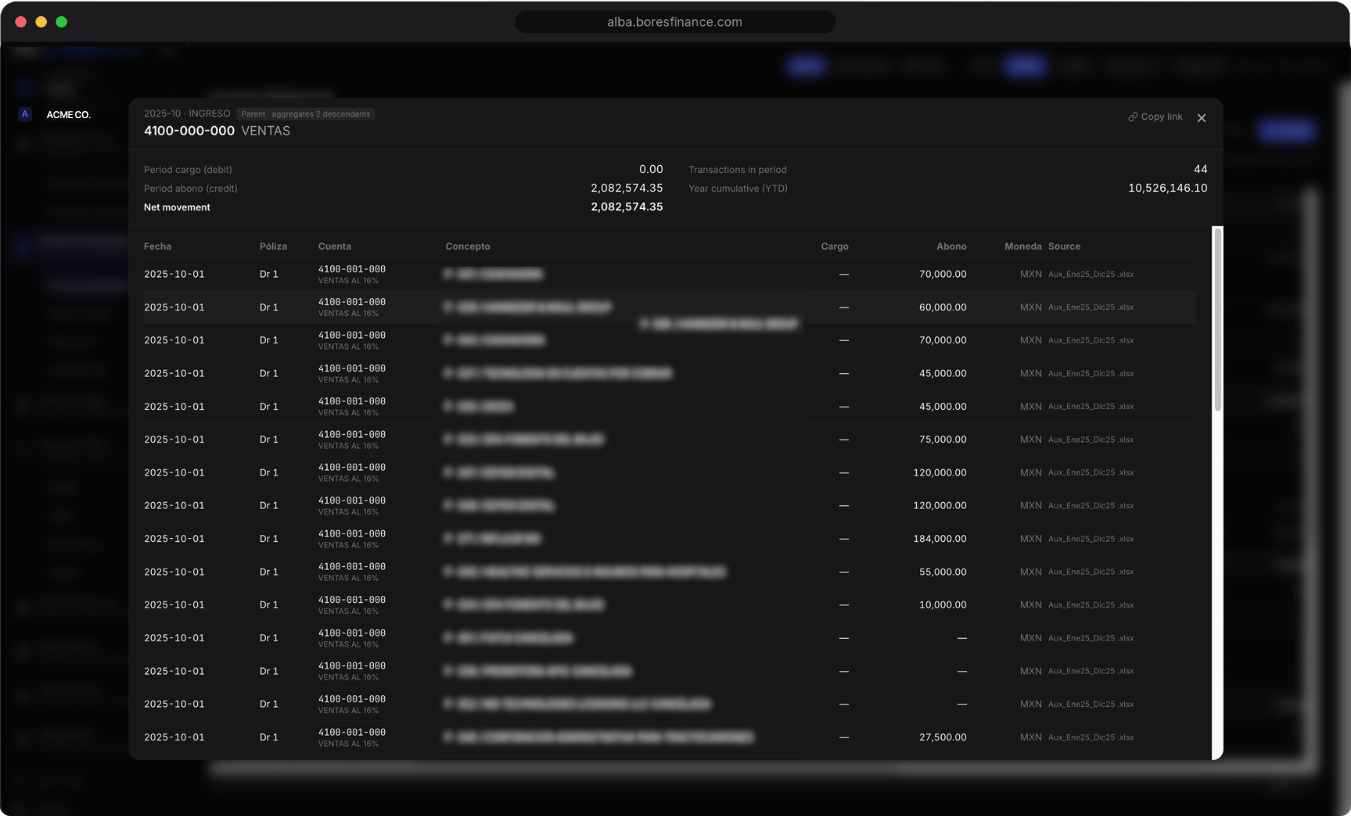
Slide to compare. With , every figure in your income statement is traceable to the journal entry behind it.
What changed and why, in seconds
doesn't just show the number: it explains what moved it.
Every figure, traceable
From the income statement to the journal entry behind it, in one click.
Senior judgment + AI
What takes a traditional team weeks, in days.
A module of

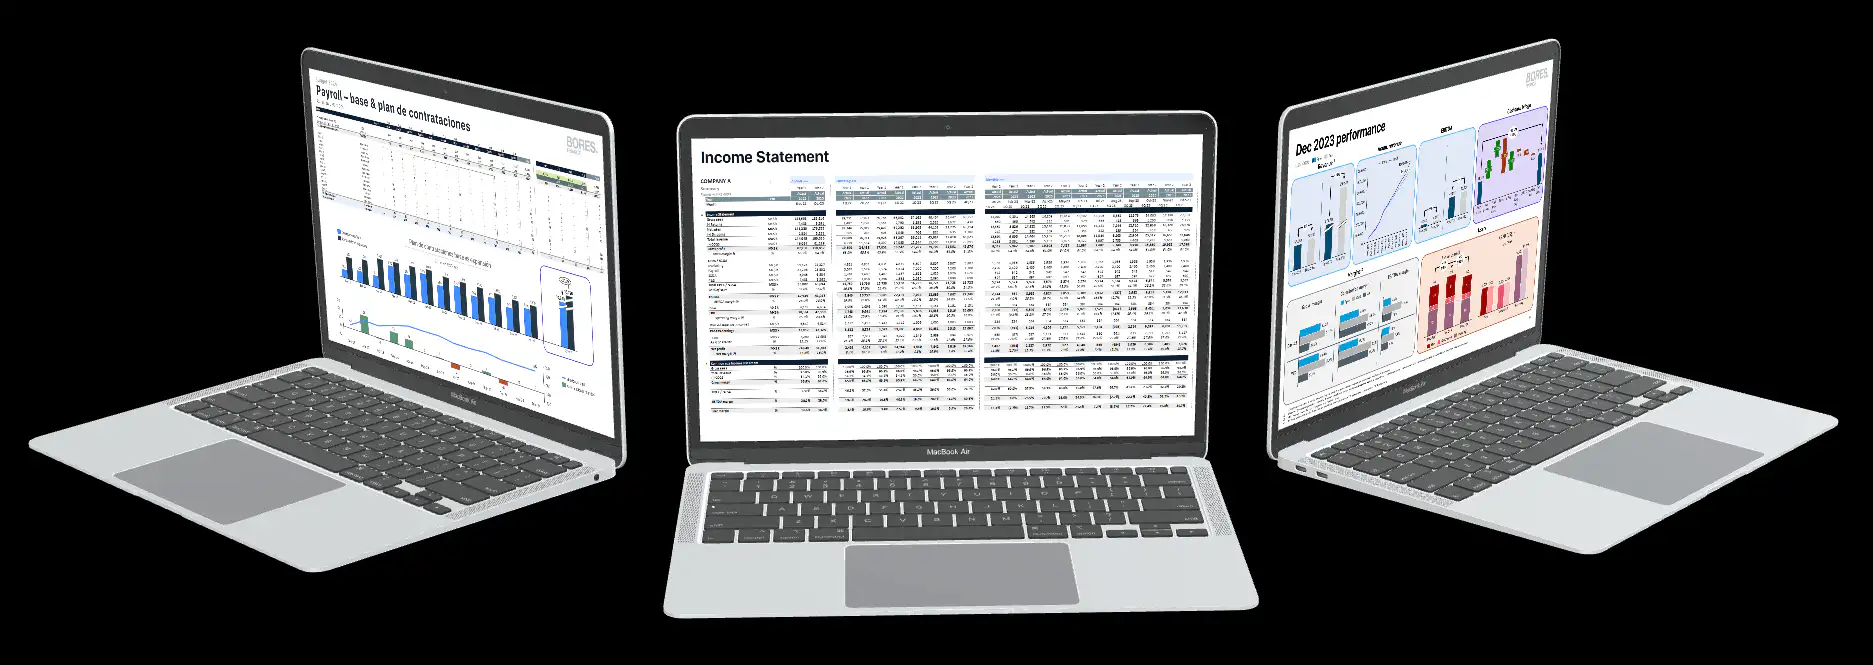
Visualize. Analyze. Execute.
DataStudio® is the visual layer of : it turns dense financial statements into clear dashboards, ready for decisions. Not a separate product: it’s included.
Dashboards your team understands.From the spreadsheet to a view anyone can read in seconds.
Designed for decisions.They highlight what matters and what’s hidden, not just chart it.
Included in your service.Comes with : no licenses or extra costs.
: no licenses or extra costs. isn't sold separately. It's included.
We don't sell licenses: is part of our financial intelligence service. We connect your sources, configure it for your business and our team uses it with you every week to decide.
"This could be the first time finance feels like an advantage."What we want you to feel when you log in to .
Frequently asked questions
Is software I have to learn how to use?
No. is how we deliver financial intelligence to you. We connect your sources, configure it for your business and use it with you in the weekly sessions. You just log in and see where you stand.
is how we deliver financial intelligence to you. We connect your sources, configure it for your business and use it with you in the weekly sessions. You just log in and see where you stand.What systems does it connect to?
The tools your team already uses: your ERP, CONTPAQi, Excel and other data sources. In the diagnostic session we review which ones you have and how we integrate them.
What is DataStudio® and how does it relate to ?
DataStudio® is the visual layer of : the dashboards that turn dense financial statements into clear information for your whole team. It's included in .
: the dashboards that turn dense financial statements into clear information for your whole team. It's included in .How can I see ?
Book your free 30-minute diagnostic and we'll show you with examples similar to your company.
with examples similar to your company.
Filtrado. The week's news, explained in money.
Markets, business and the economy from a financial perspective. Every Monday in your inbox, free.

1999





 Log in